2017 ~ informasi seputar dunia forex

Thursday 14 December 2017

Catat! Jangan Tergoda Investasi di 21 Perusahaan Ini

Berita ini di lansir media online terkemuka di Indonesia detikdotcom, pada Kamis 14 Dec 2017, 16:39 WIB


Jakarta - Masyarakat diharapkan sangat berhati-hati sebelum berinvestasi. Satuan Tugas Penanganan Dugaan Tindakan Melawan Hukum di
Bidang Penghimpunan Dana Masyarakat dan Pengelolaan Investasi atau Satgas Waspada Investasi mengumumkan 21 entitas yang diduga bodong.

Ketua Satgas Waspada Investasi Tongam L Tobing, menjelaskan entitas tersebut tidak memiliki izin usaha penawaran produk dan penawaran investasi sehingga berpotensi merugikan masyarakat karena imbal hasil atau keuntungan yang dijanjikan tidak masuk akal.

"Untuk terus melindungi konsumen dan masyarakat, Satgas Waspada Investasi meminta kepada masyarakat agar berhati-hati terhadap penawaran dan produk dari 21 entitas itu," ungkap Tongam dalam keterangan tertulisnya, Kamis (14/12/2017).

Berikut 21 entitas yang dimaksud:


Thursday 19 October 2017

Price Action System

yea.... preferred trading style is price action/candle stick patterns as it makes the most sense to me. I’ve read pretty much all of Steve Nison’s content. I then came across Walter Peters book the Naked Forex and was instantly hooked. His rules were clear which made it easy to identify certain patterns. My problem was is that I would have to sit there and check each bar if the criteria had been met. There had to be another way?

With all my knowledge on candlestick patterns I have started my quest on creating an all in one price action indicator for MT4. I am no coder so have hired someone to do this for me. I am happy to say that I would like share version 1.0 with the community. I decided to give the indicator a name One Glance Trader (OGT) Price Action indicator. I came up with the name OGT because you can visually see any opportunities instantly!

What is included in version 1.0

This version only contains one pattern which is the pin bar/kangaroo tail (as Walter puts it). I have had coded the rules from his book and YouTube videos. Here are the rules applied:

1) Open and close are inside the previous candle

Self-explanatory hard coded in indicator

2) Open and close are in the bottom third (bearish)/ top third (bullish) of the candle's range

Self-explanatory hard coded in indicator

3) Decent amount of "room to the left"

Walter talks about pin bars forming at a price where price has not been for a very long time, creating a better indication of a reversal. To apply this in the indicator it checks if the top/bottom of the rejection wick has been where price has not been for a long time. You can set the amount of the wick (in %) and it will tell you how many bars ago price was (see image below for example).

4) Candle range greater than the previous 4 candles

Self-explanatory, you can set the number of previous candles to check.
As you can see from the image above, the above pin bar formed meets all the rules. This is EUR/USD Daily chart. The Pin bar was formed on April 3rd 2017. The number (212) means that the top 25% of the rejection wick has not been at that price for the last 212 bars (212 days). The number is in red to represent a sell signal. As you can see there was a circa 450 pip selloff.

I would not use this indicator as a standalone indicator. Use other indicators/PA for confluence.

I have created a video that goes into the settings in much more detail and how to use it properly.

I am looking for your feedback to improve the indicator and also what patterns you want to see in the upcoming versions.

source : ff
owner thread

Friday 22 September 2017

Trade using Fibonacci RET

Trading using fibonacci RET (retracement, expansion and time projection)

On the topic this time, we learn to use Fibonacci intactly, why must with Fibonacci .. ??? here I invite readers to learn, because if we hone on fibonacci then we will be able to know where the direction of the market, if you do not want to learn then I do not do forex trading business, because forex trading business we have to learn to learn, because of learning we can get profit

Fibonacci Retracement 

In finance, Fibonacci retracement is a method of technical analysis for determining support and resistance levels. They are named after their use of the Fibonacci sequence. Fibonacci retracement is based on the idea that markets will retrace a predictable portion of a move, after which they will continue to move in the original direction.
Fibonacci retracement

The appearance of retracement can be ascribed to ordinary price volatility as described by Burton Malkiel, a Princeton economist in his book A Random Walk Down Wall Street, who found no reliable predictions in technical analysis methods taken as a whole. Malkiel argues that asset prices typically exhibit signs of random walk and that one cannot consistently outperform market averages. Fibonacci retracement is created by taking two extreme points on a chart and dividing the vertical distance by the key Fibonacci ratios. 0.0% is considered to be the start of the retracement, while 100.0% is a complete reversal to the original part of the move. Once these levels are identified, horizontal lines are drawn and used to identify possible support and resistance levels (see trend line). The significance of such levels, however, could not be confirmed by examining the data. Arthur Merrill in Filtered Waves determined there is no reliably standard retracement: not 50%, 33%, 38.2%, 61.8%, nor any other.

Common Uses
Fibonacci retracement is a popular tool that technical traders use to help identify strategic places for transactions, stop losses or target prices to help traders get in at a good price. The retracement concept is used in many indicators such as Tirone levels, Gartley patterns, Elliott Wave theory and more. After a significant movement in price (be it up or down) the new support and resistance levels are often at these lines.
fibonacci retracement on maping market weekly


Unlike moving averages, Fibonacci retracement levels are static prices. They do not change. This allows quick and simple identification and allows traders and investors to react when price levels are tested. Because these levels are inflection points, traders expect some type of price action, either a break or a rejection. The 0.618 Fibonacci retracement that is often used by stock analysts approximates to the "golden ratio"

source wikipedia

Fibonacci Expansion


Fibonacci Expansions plot possible levels of support and resistance.
They are created by tracking primary trending moves and their retracements.
Traders can use Fibonacci Expansions to set multiple profit targets for their trades.
A concept I always teach is the importance of using support and resistance levels to decide when to get out of positions. Just like getting a good entry is important for a successful trade, you must also ensure you are exiting your trades at levels that maximize your gains. This article aims to assist traders in finding profit maximizing exit levels using Fibonacci Expansions.

What are Fibonacci Expansions?

Fibonacci Expansions are price levels created by tracking a price’s primary move and its retracement. The resulting price levels are then drawn on the chart in an area that would normally be difficult to gauge support and resistance using ordinary charting tools. This makes Fibonacci Expansion especially useful for picking profit targets when trading trends.

When faced with an upward trending currency pair, there are going to be times when price temporarily moves counter to the trend. We call these moves pullbacks or retracements. Once this counter move is exhausted, price resumes back in the direction of the primary trend and often times will break to new highs. It is at that moment, that Fibonacci can be used.


While the familiar Fibonacci Retracements are used to determine how far the price might originally retrace, Fibonacci Expansions can help us determine where price might head after the retracement is exhausted. On the EUR/USD daily chart below, I have highlighted a primary move followed by a retracement move.

Fibonacci Time Projection

Introduction

Fibonacci Time Zones are vertical lines based on the Fibonacci Sequence. These lines extend along the X axis (date axis) as a mechanism to forecast reversals based on elapsed time. A major low or high is often chosen as the starting point. Distances start relatively small and grow as the Fibonacci Sequence extends. Chartists can extend the Fibonacci Time Zones into the future to anticipate potential reversal points.

Definition

Fibonacci time projection days are days on which a price event is supposed to occur. Time projection analysis is not lagging but is of forecasting value. Trades can be entered or exited at the price change rather then after the fact. The concept is dynamic. The distance between two turning points is seldom the same, and time projection days vary, depending on larger or smaller swing sizes of the market price pattern. This base for drawing this shape is 2 critical points: two highs, two lows or a low and a high. Fibonacci levels are projected into the future based on those points and at this time it is impossible to say whether those levels mark peaks or valleys. If price is declining or rising approaching a given Time Projection level, it is likely this level will mark an end or a pause of a particular trend. It is always recommended to combine Time Projection with other Fibonacci tools for more dependable signals.

Fibonacci time projection is one of the four most popular Fibonacci studies for technical analysis, involving the use of Fibonacci time zones. Fibonacci time zones are generated by dividing a chart into a number of time areas, based on the Fibonacci sequence. As an example, if the base increment is taken to be an interval of one day, Fibonacci time zones would occur around 1.618 days after that day, then 2.618 days after that, then 4.236 and so on. Each interval is multiplied by the golden ratio, 1.618, in order to generate the next interval. These Fibonacci time zones are used to predict large price events, whether reversals of a current price trend or sharp changes in price along with the trend.

Fibonacci time projection is accurate to a point, but in a few cases large price events occur significantly before or after the time predicted by the Fibonacci time projection. Although this only describes about 30% of cases, Fibonacci time projection should only be used in conjunction with other technical analysis tools, and as a guideline for trading rather than a sure-fire method of divining the future.

The Sequence and Ratios

This article is not designed to delve too deep into the mathematical properties behind the Fibonacci sequence and Golden Ratio. There are plenty of other sources for this detail. A few basics, however, will provide the necessary background for the most popular numbers. Leonardo Pisano Bogollo (1170-1250), an Italian mathematician from Pisa, is credited with introducing the Fibonacci sequence to the West. It is as follows:

0, 1, 1, 2, 3, 5, 8, 13, 21, 34, 55, 89, 144, 233, 377, 610……

The sequence extends to infinity and contains many unique mathematical properties.


After 0 and 1, each number is the sum of the two prior numbers (1+2=3, 2+3=5, 5+8=13 8+13=21 etc…).
A number divided by the previous number approximates 1.618 (21/13=1.6153, 34/21=1.6190, 55/34=1.6176, 89/55=1.6181). The approximation nears 1.6180 as the numbers increase.
A number divided by the next highest number approximates .6180 (13/21=.6190, 21/34=.6176, 34/55=.6181, 55/89=.6179 etc….). The approximation nears .6180 as the numbers increase. This is the basis for the 61.8% retracement.
1.618 refers to the Golden Ratio or Golden Mean, also called Phi. The inverse of 1.618 is .618. These ratios can be found throughout nature, architecture, art and biology. In his book, Elliott Wave Principle, Robert Prechter quotes William Hoffer from the December 1975 issue of Smithsonian Magazine:

….the proportion of .618034 to 1 is the mathematical basis for the shape of playing cards and the Parthenon, sunflowers and snail shells, Greek vases and the spiral galaxies of outer space. The Greeks based much of their art and architecture upon this proportion. They called it the golden mean.

Interpretation

The slow start in the Fibonacci sequence creates relatively tight clustering at the beginning of the Fibonacci Time Zones. Sometimes, it is necessary to ignore the first 5 or so time zones. After the first five zones, these zones expand quite quickly as the sequence unfolds. According to the theory, potential reversal points can be found by looking ahead 21, 34, 55, 89 and 144 days, all of which are Fibonacci numbers. 21 days marks the 8th Fibonacci Time Zone. Some subsequent zones are listed below. Remember, you can find future times zones by adding the previous two time zones (89 + 144 = 233).

8th zone = 21 days or periods
9th zone = 34 days or periods
10th zone = 55 days or periods
11th zone = 89 days or periods
12th zone = 144 days or periods
13th zone = 233 days or periods

Conclusions

Fibonacci Time Zones are called “zones” for a reason. They are not hard reversal points, but rather potential reversal points to watch as prices approach this zone. Fibonacci Time Zones provide a cross between cycle analysis and Fibonacci analysis. Both have a wide following and turning points can be forecast weeks and months in advance. However, these forecast points serve as an alert for a potential trend reversal. As these reversal points approach, chartists should turn to other aspects of technical analysis to actually confirm the reversal. This could be a bullish or bearish pattern, bullish or bearish candlesticks, bullish or bearish indicators or clues from the price chart itself.

BREAKING DOWN 'Fibonacci Time Zones'
Fibonacci numbers are a sequence of numbers where each successive number is the sum of the two previous numbers. For reasons unknown, these numbers play an important role in determining relative areas where the prices of financial assets experience large price moves or change direction. The four popular Fibonacci studies are arcs, fans, retracements and time zones.

on the topic this time, we learn to use Fibonacci intactly, why must with Fibonacci .. ??? here I invite readers to learn, because if we hone on fibonacci then we will be able to know where the direction of the market, if you do not want to learn then I do not do forex trading business, because forex trading business we have to learn to learn, because of learning we can get profit


Wednesday 13 September 2017

bitcoin Indonesia

Bagi kalangan trader online, trader forex online di Indonesia sudah tidak asing lagi dengan bitcoin, pada topik kali ini saya berusaha memuat apa itu bitcoin dari sumber berita wikipedia.
Bitcoin adalah sebuah uang elektronik yang di buat pada tahun 2009 oleh Satoshi Nakamoto. Nama tersebut juga dikaitkan dengan perangkat lunak sumber terbuka yang dia rancang, dan juga menggunakan jaringan peer-ke-peer tanpa penyimpanan terpusat atau administrator tunggal di mana Departemen Keuangan Amerika Serikat menyebut bitcoin sebuah mata uang yang terdesentralisasi . Tidak seperti mata uang pada umumnya, bitcoin tidak tergantung dengan mempercayai penerbit utama. Bitcoin menggunakan sebuah database yang didistribusikan dan menyebar ke node-node dari sebuah jaringan P2P ke jurnal transaksi, dan menggunakan kriptografi untuk menyediakan fungsi-fungsi keamanan dasar, seperti memastikan bahwa bitcoin-bitcoin hanya dapat dihabiskan oleh orang memilikinya, dan tidak pernah boleh dilakukan lebih dari satu kali.

Desain dari Bitcoin memperbolehkan untuk kepemilikan tanpa identitas (anonymous) dan pemindahan kekayaan. Bitcoin - bitcoin dapat disimpan di komputer pribadi dalam sebuah format file wallet atau di simpan oleh sebuah servis wallet pihak ketiga, dan terlepas dari semua itu Bitcoin - bitcoin dapat di kirim lewat internet kepada siapapun yang mempunyai sebuah alamat Bitcoin. Topologi peer-to-peer bitcoin dan kurangnya administrasi tunggal membuatnya tidak mungkin untuk otoritas, pemerintahan apapun, untuk memanipulasi nilai dari bitcoin - bitcoin atau menyebabkan inflasi dengan memproduksi lebih banyak bitcoin.

Bitcoin adalah salah satu dari implementasi pertama dari yang disebut cryptocurrency, pertama kali di deskripsikan oleh Wei Dai pada tahun 1998 dalam milis cypherpunks.
Bitcoin mengandalkan pada jumlah pemindahan di antara rekening publik menggunakan kriptografi kunci publik. Semua transaksi - transaksi terbuka untuk umum dan disimpan dalam sebuah database yang didistribusikan. Untuk mencegah pengeluaran-ganda, jaringan mengimplementasikan sebuah server waktu yang di distribusikan, menggunakan ide perantaian bukti dari kerja. Keseluruhan sejarah dari transaksi - transaksi telah di simpan dengan semestinya dalam database dan untuk mengurangi ukuran dari tempat penyimpanan, sebuah pohon Merkle digunakan.

Teknis
Bitcoin adalah sebuah implentasi peer-to-peer dari proposal b-money oleh Wei Dai dan proposal Bitgold oleh Nick Szabo. Prinsip dari sistem secara umum telah di deskripsikan pada tahun 2008 oleh Satoshi Nakamoto.

Produksi Bitcoin
Jaringan Bitcoin secara acak membuat dan mendistribusikan sekumpulan dari bitcoin - bitcoin yang baru sekitar 6 kali dalam satu jam ke seseorang yang menjalankan perangkat lunak dengan opsi 'menghasilkan koin' yang telah dipilih sebelumnya. Setiap pengguna berpotensi menerima sekumpulan dengan menjalankan opsi itu, atau program yang telah dispesialisasikan untuk dijalankan di alat yang pengguna punya (contohnya kartu grafis - VGA). Menghasilkan bitcoin - bitcoin adalah sering diistilahkan sebagai "menambang", sebuah istilah yang sama dengan analogi penambangan emas. Mengenai probabilitas kemungkinan bahwa seorang pengguna akan menerima sekumpulan sangat bergantung pada kekuatan komputasi yang dia kontribusikan ke jaringan yang juga berhubungan dengan gabungan kekuatan komputasi dari semua node - node. Jumlah dari bitcoin yang dibuat dalam setiap kumpulan adalah tidak lebih dari 50 BTC, dan seiringan dengan waktu penghargaannya juga telah diprogram untuk berkurang sampai ke titik nol, dengan begitu tidak akan ada lebih dari 21 juta bitcoin yang akan ada.Seiring dengan pembayaran berkurang, maka motif dari pengguna tersebut diharapkan akan berubah untuk mendapatkan biaya Transaksi.
Semua node - node yang menghasilkan dari jaringan adalah berkompetisi untuk menjadi yang pertama dalam mencari sebuah solusi untuk sebuah masalah kriptografi mengenai blok-kandidatnya, sebuah masalah yang mengharuskan pengulangan percobaan dan kesalahan. Ketika sebuah node menemukan sebuah solusi yang benar, maka akan mengumumkannya ke sisa dari jaringan dan mengklaim sekumpulan dari bitcoin - bitcoin. Anggota - anggota dari jaringan akan menerima blok yang telah dipecahkan dan menvalidasikannya sebelum menerima secara penuh, dan menambahkannya ke rantai. Nodes dapat memperkerjakan Unit Pengolah Pusat mereka menggunakan klien standar atau menggunakan perangkat lunak lainnya yang memanfaatkan kekuatan dari Graphics processing unit mereka.Pengguna juga dapat menghasilkan bitcoin secara kolektif.
Dikarenakan setiap satu blok akan dihasilkan setiap 10 menit, maka setiap node secara terpisah mengatur ulang kesulitan dari masalah yang dicoba untuk dipecahkan setiap dua dua minggu sekali untuk setiap perubahan dari kekuatan keseluruhan unit pengolah pusat(CPU) dari jaringan peer-ke-peer


Saturday 9 September 2017

North Korea Vs USA = Profit

This week we bring you a unique trading opportunity based on the ongoing developments surrounding North Korea and its conflict with the United States.
North Korea is a closed, isolated country that is not a part of the global economy. However, this country has an impact on the rates of major currencies including the U.S. dollar. North Korea, hostile towards the neighboring South Korea, Japan, and some US territories, periodically threatens these countries. Nowadays this conflict is limited by the exchange of threats, military exercises and weapon testing, but each threat is noted by the global market and by investors as a signal that it is time to invest in “safe assets.” The more significant the threats, the more they affect the market. As a result, we have a chance to get high profit quickly, if we pay attention to the geopolitical situation.
As for the threats, the President of the United States Donald Trump, as well as the leader of North Korea Kim Jong-Un, do not limit themselves in this and seem to compete with each other to see whose threat will be better. Of course, such a conflict could potentially lead to a full-scale war, but for now we can continue to watch quietly how North Korea is able to bring traders impressive gains amid new weapons testing and new threats exchanges between the US and North Korea. There probably is no other isolated country which can affect the market this way. A new round of conflict occurred on September 3, when North Korea announced a successful test of a hydrogen bomb.

In these restless times the Gold becomes a great tool for investment again. The latest news about the escalation of the conflict was immediately reflected in the value of the dollar, the yen, but above all, the intensification of the conflict had an impact on the value of gold, which has already risen to $1,334, the maximum for the past year. If you opened the deals to BUY last week, you would earn a very high profit now, but we'll have a lot of other possibilities to earn, thanks to North Korea. Soon we would have at least a new price correction, as soon as this round of conflict subsides. This means that now it's rather easy to make a profit in Forex trading using Gold, the yen, or the dollar. All you need to do is follow the news concerning the Korean Peninsula and the statements by the leaders of the United States and North Korea related to the conflict.
source

Sunday 27 August 2017

Trade Mirror and Trade Copier With MT4i

The Personal Trade Copier duplicates trades between two copies of MetaTrader 4 running on the
same computer. You place trades in one copy of MT4, and these are replicated almost instantly in the
other copy of MT4. The trade copier duplicates both manual and automated trading.

You can copy from multiple instances of MT4 into a single receiver, and vice versa, by running more
than one copy of the sender and receiver.
The sending copy of MT4 does not need the ability to place trades. Therefore, the sending copy can
be logged in using the read-only MT4 “investor” password.
MT4i can also provide tools for broadcasting messages over the internet between one master copy of
MT4 and any number of receivers running anywhere in the world.

MT4i, an UK software developer running the social forex trading website MT4i.com, announced the launch of new versions of its top products - Internet Trade Mirror and Personal Trade Copier. The Internet Trade Mirror duplicates orders over the internet between copies of MetaTrader 4 on different computers, whereas The Personal Trade Copier duplicates orders between two MT4 platforms running on the same computer.
Internet Trade Mirror new features
The cap on free usage of the Internet Trade Mirror has been raised from 5 subscribers to 20 subscribers with immediate effect.

There is also an updated version of the receiver EA also with a new StopTradingAtDrawdownPercent parameter. This is similar to the existing StopTradingBelowEquity parameter, but stops trading activity when floating P/L exceeds the specified percentage of account balance.

Personal Trade Copier new features

A single sender EA can now send trades to multiple receivers. It is no longer necessary to run a separate sender for each receiver. For example, you can enter "Receiver1,Receiver2" as the Channel parameter for the sender, and that single EA will then broadcast messages to the receiver EAs with the Channel parameters "Receiver1" and "Receiver2".

The receiver EA also has a new StopTradingAtDrawdownPercent parameter. This is similar to the existing StopTradingBelowEquity parameter, but stops trading activity when floating P/L exceeds the specified percentage of account balance.

Link Donwload

Tuesday 22 August 2017

Declinations Ephemeris

Declinations Ephemeris

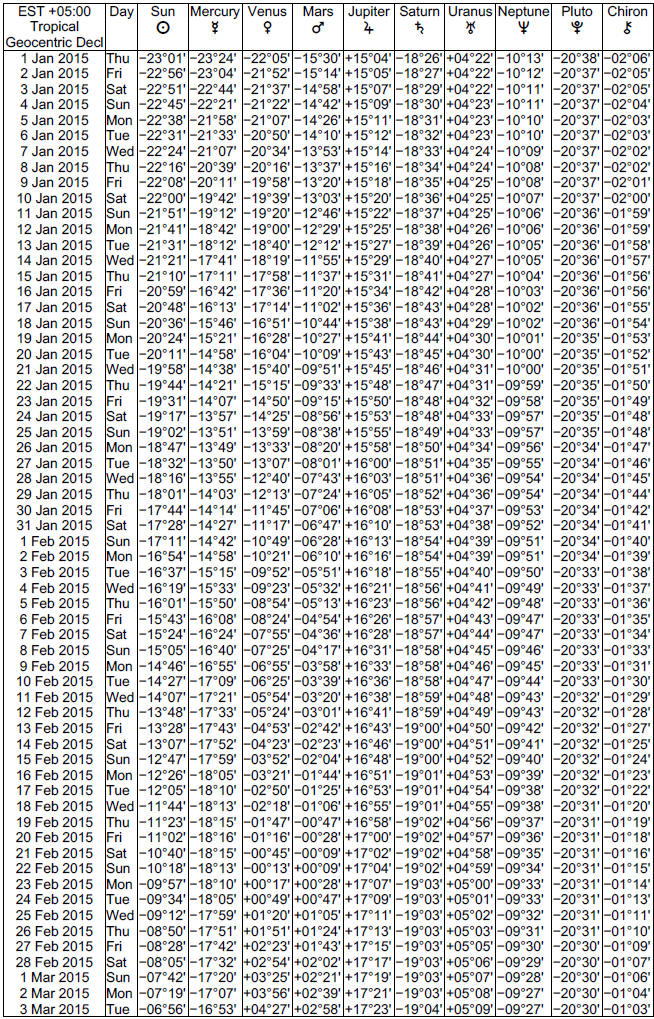
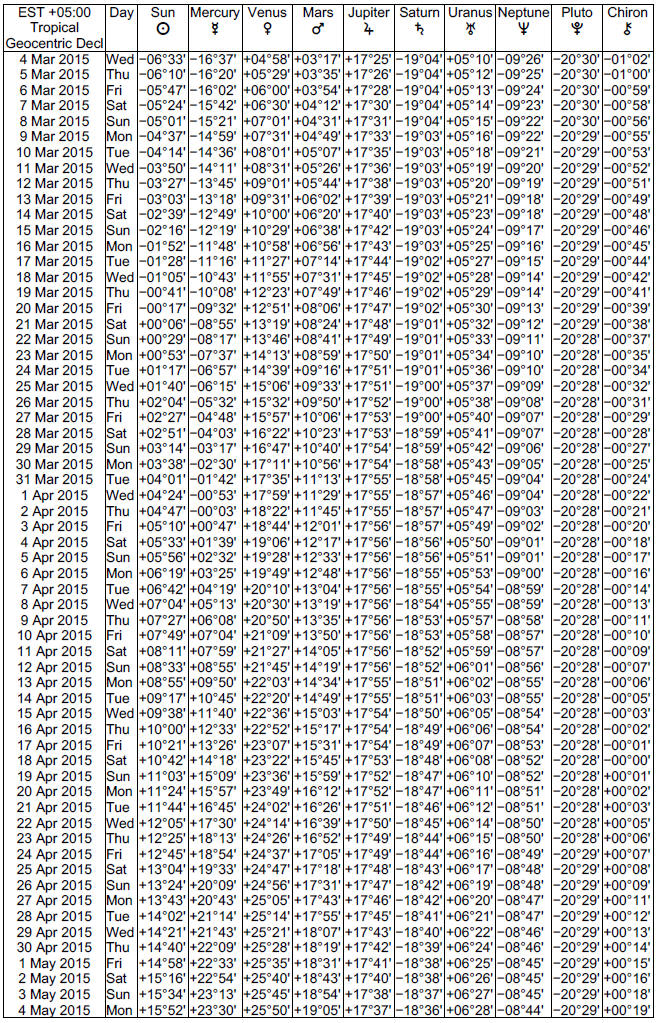
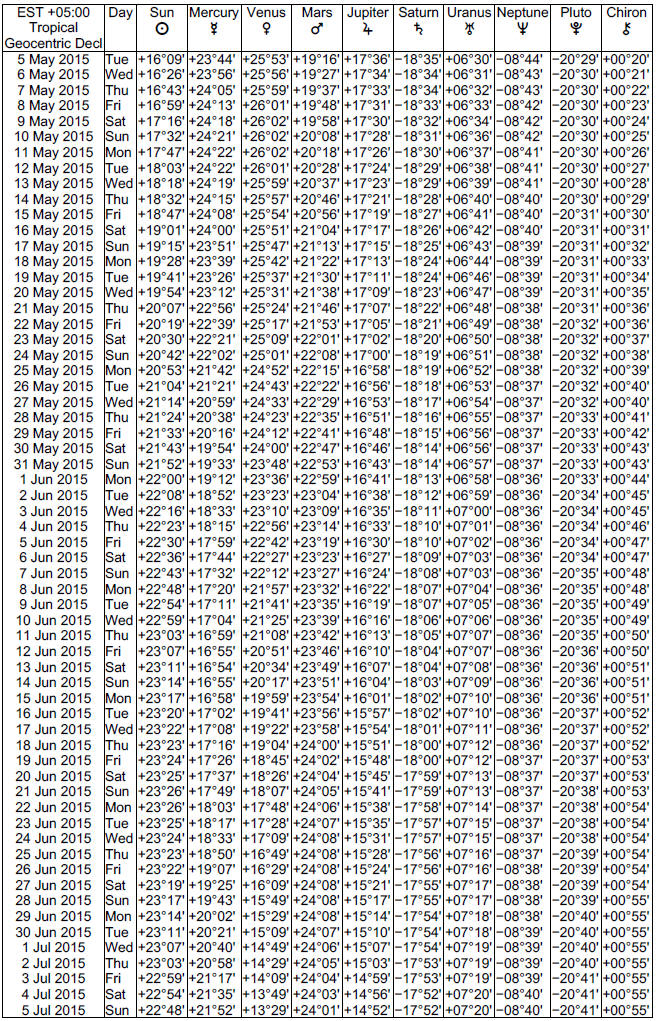
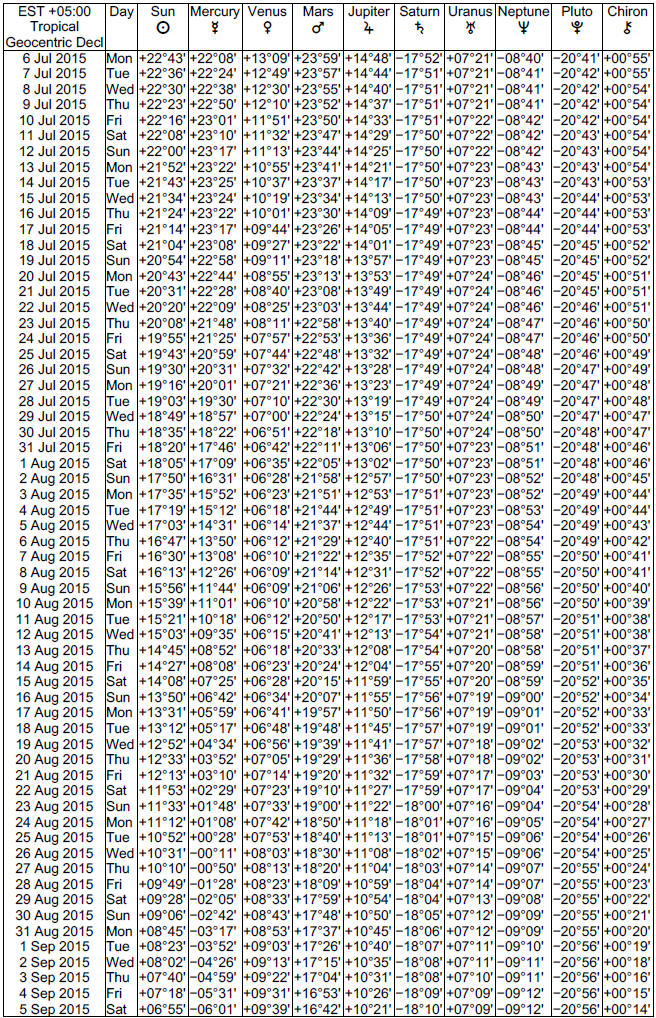
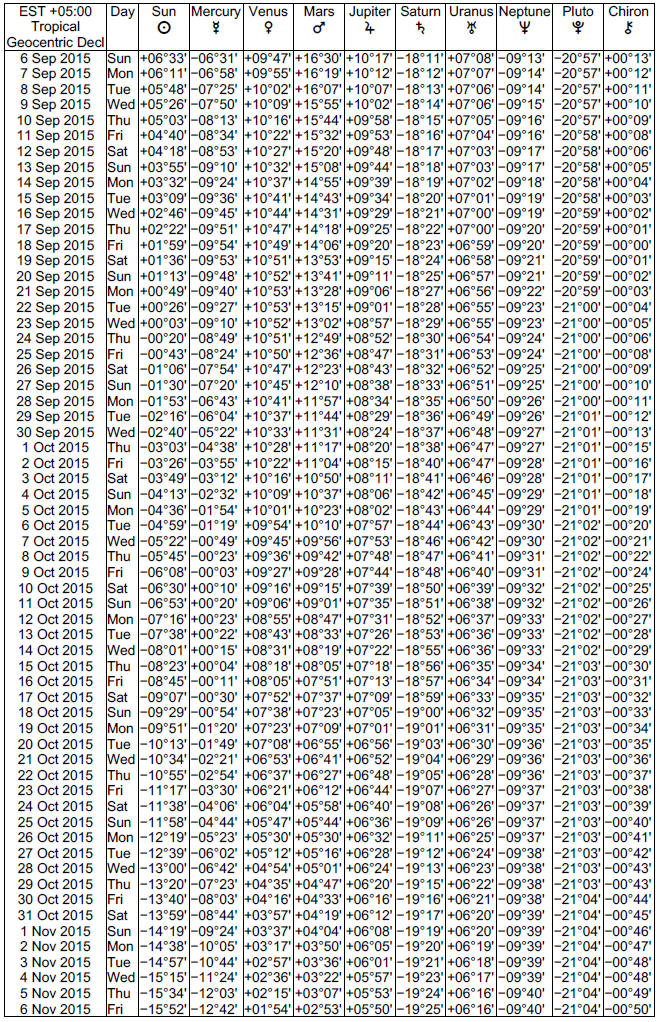
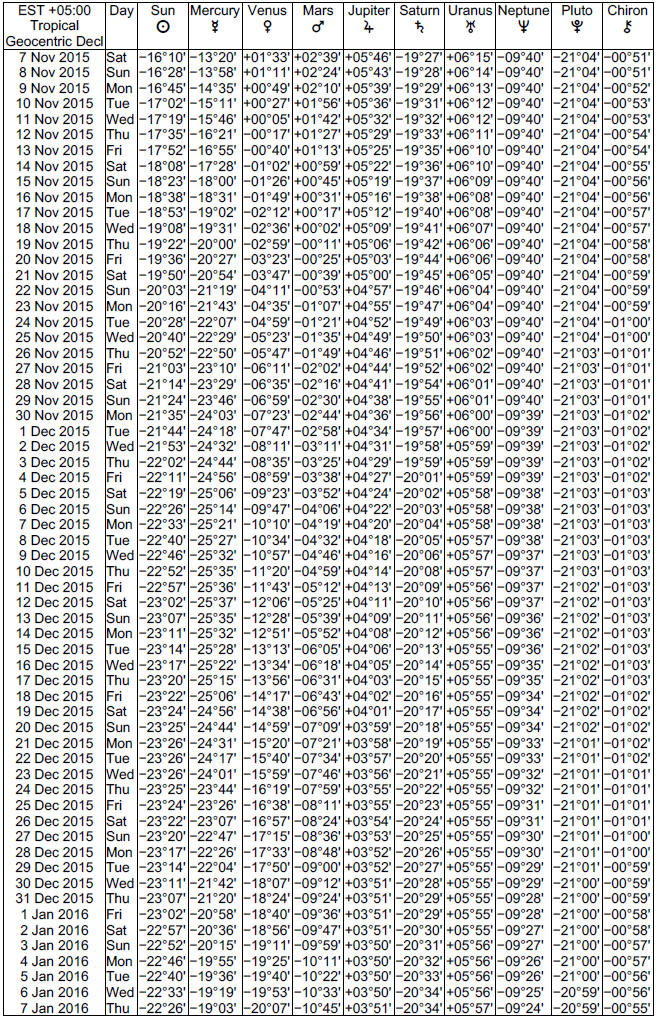
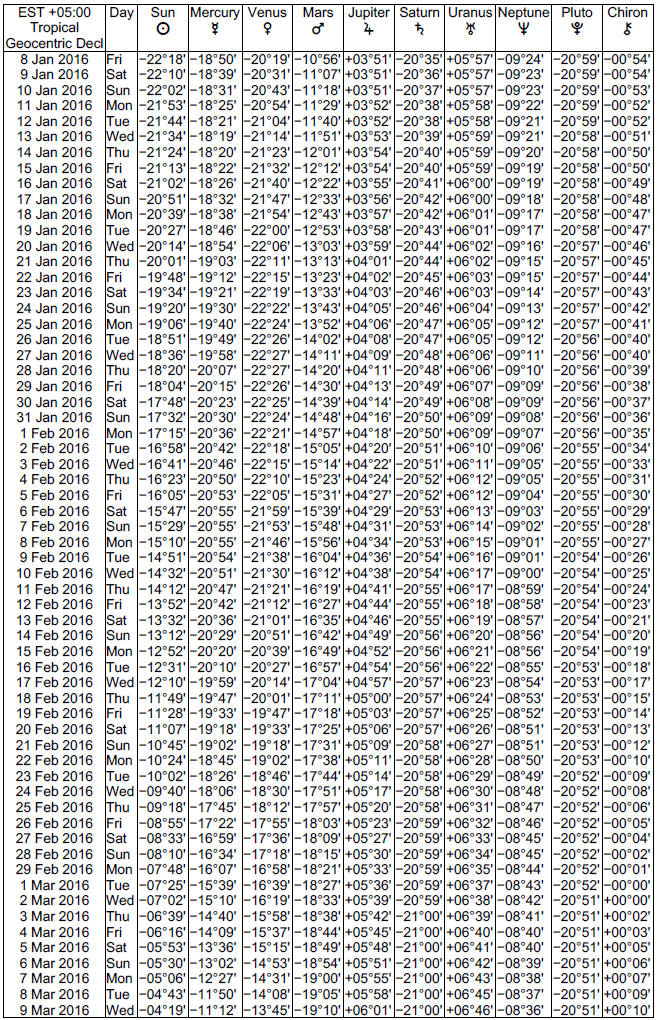
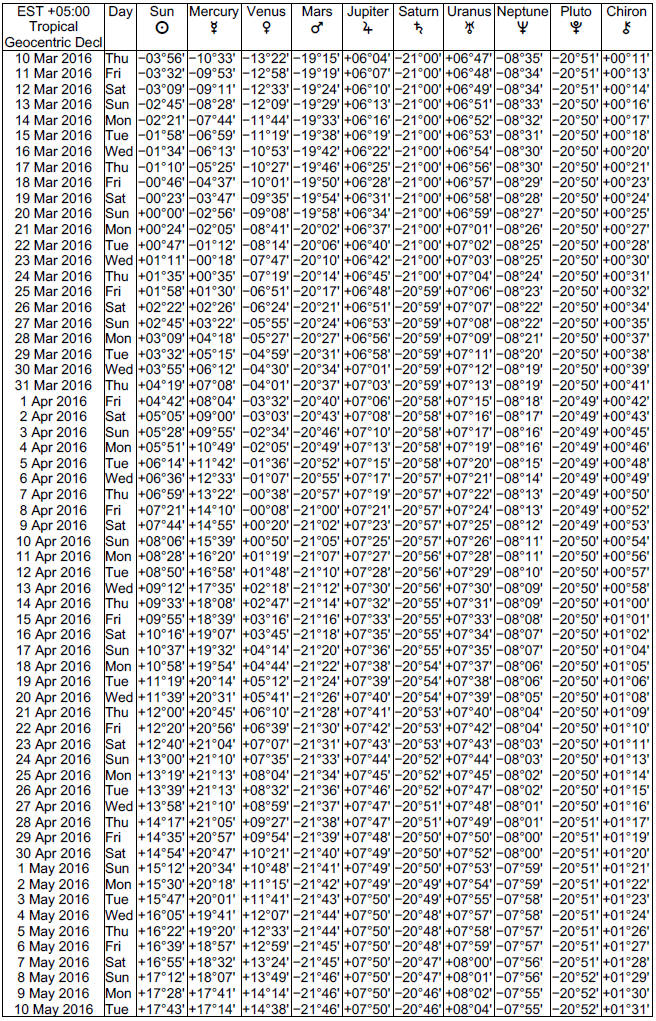
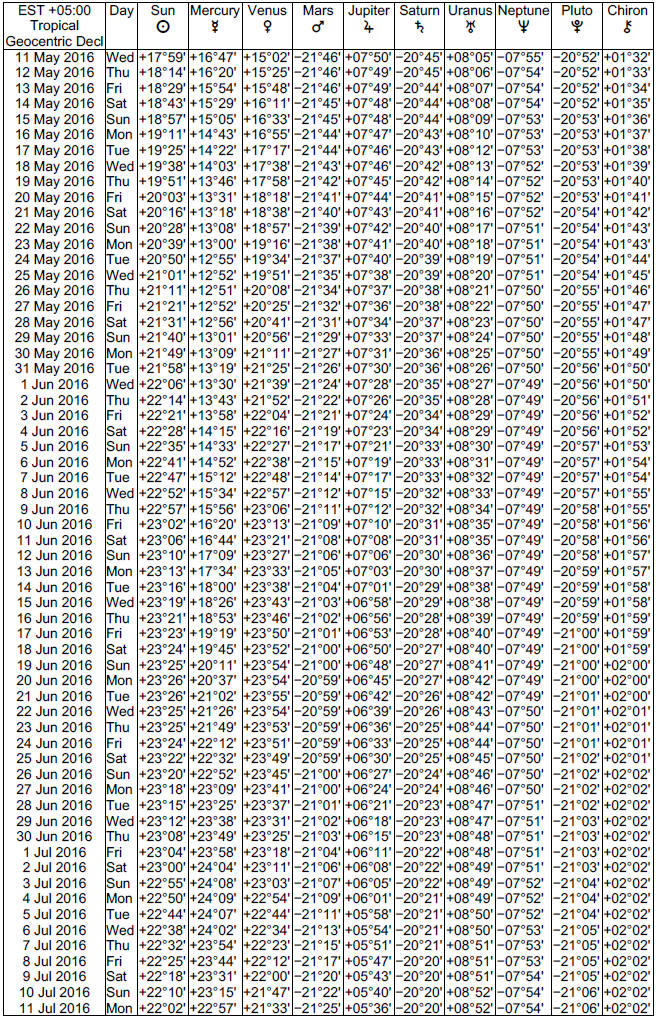
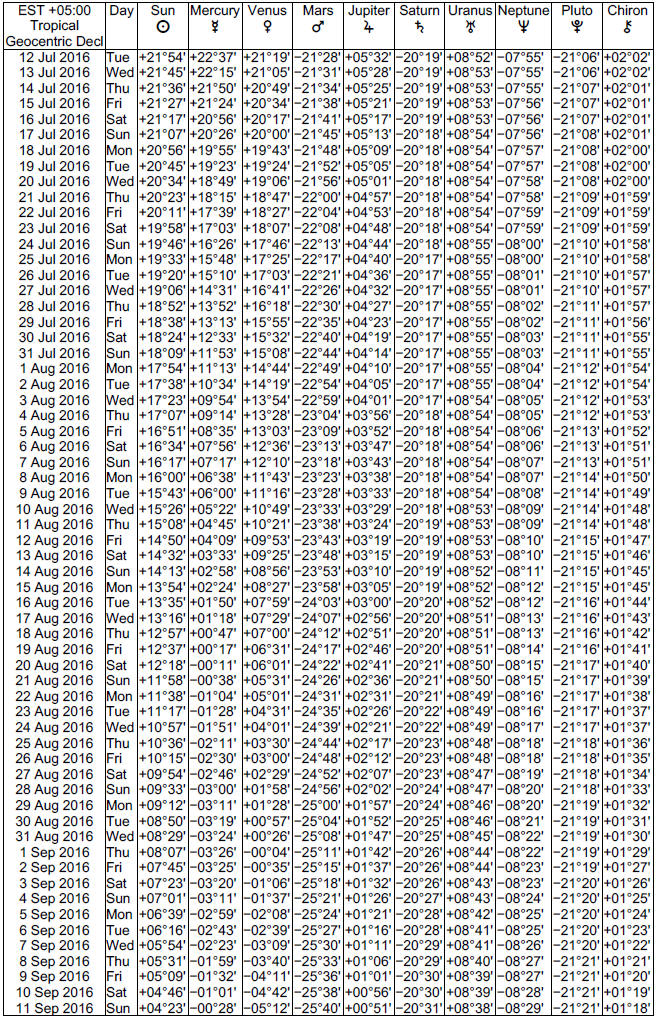
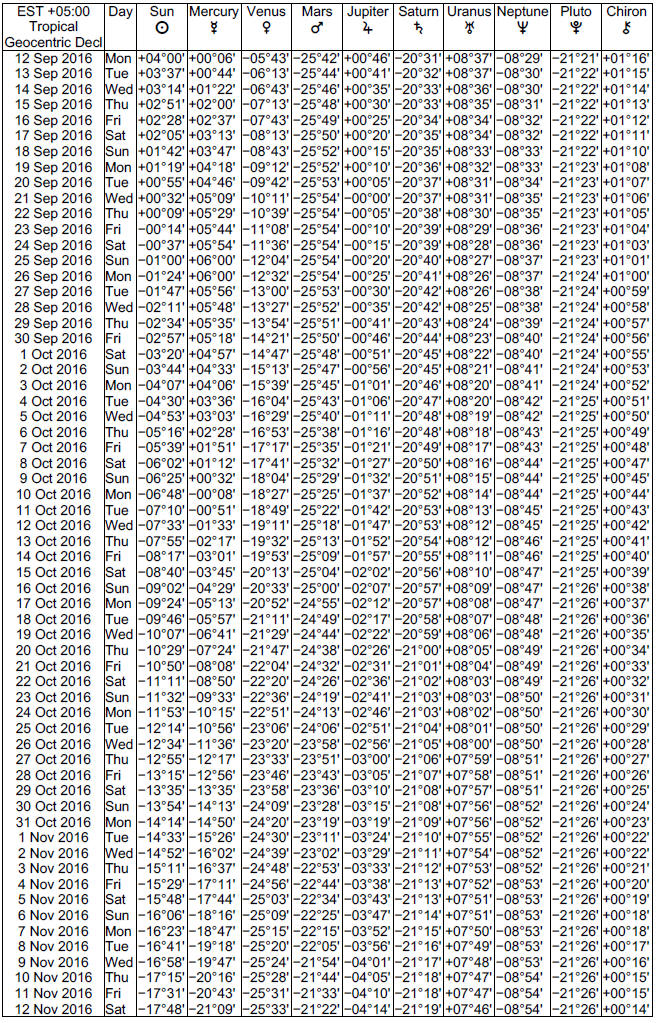
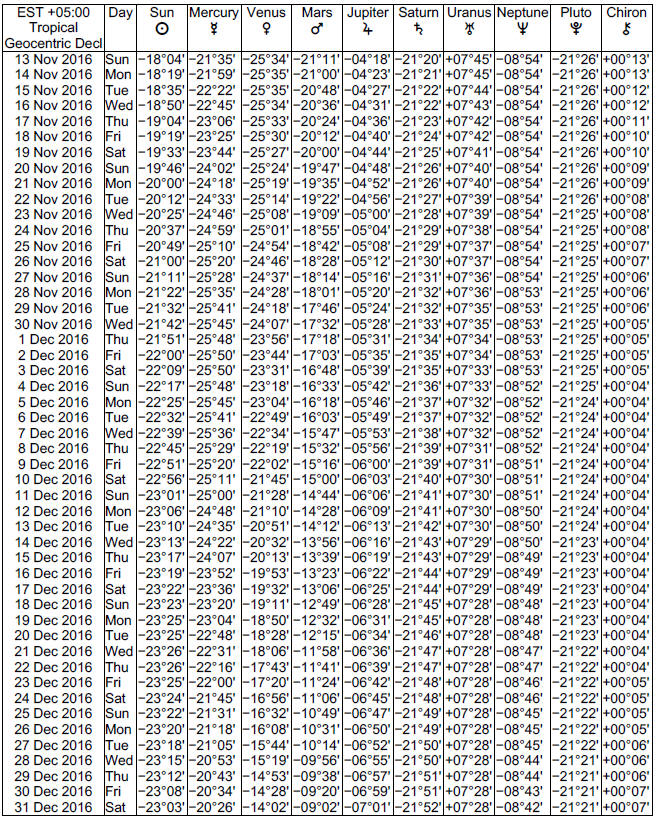
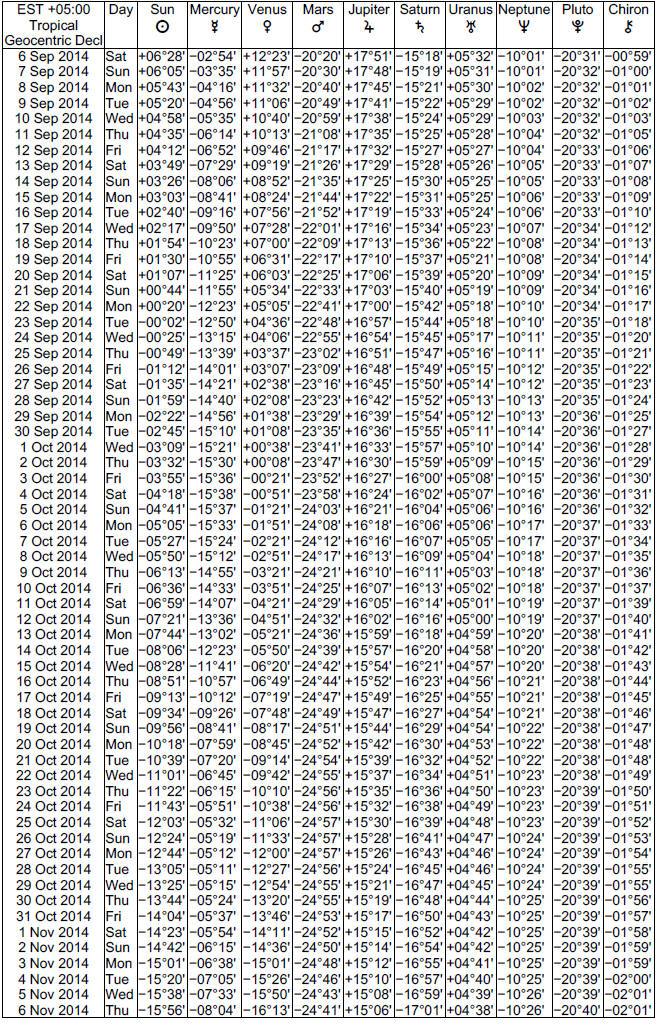
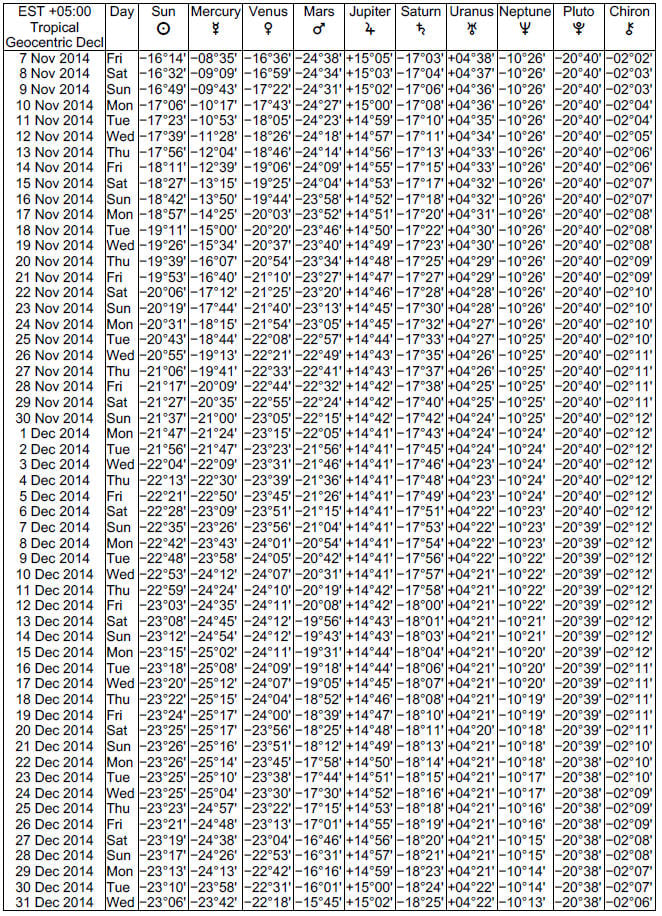
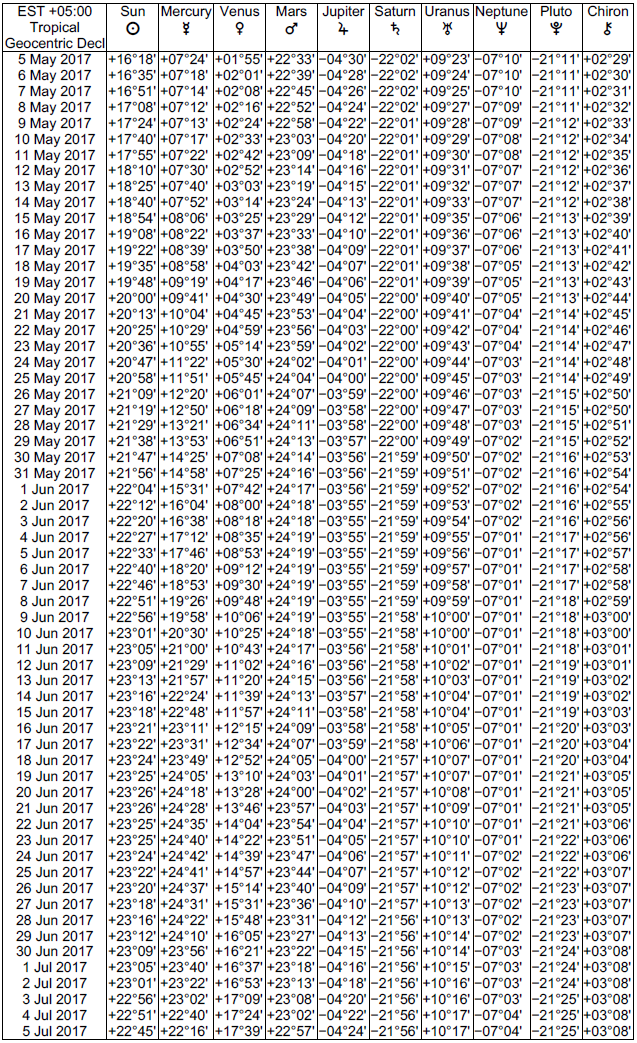
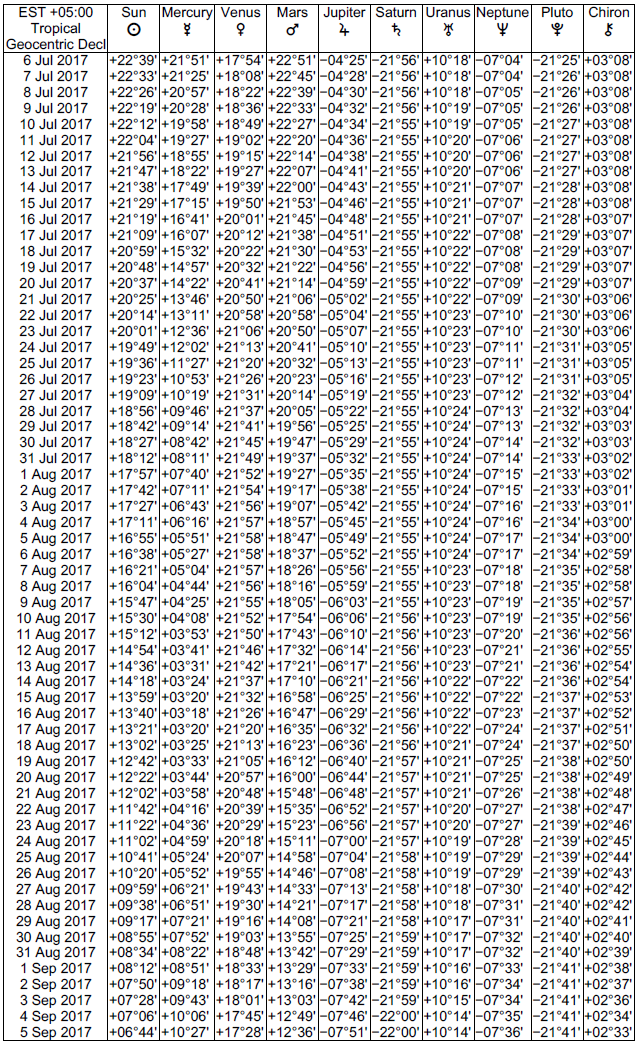
We have a Declinations Ephemeris covering the years 1930-2025, and that can be found here: Declinations Ephemeris, in pdf format, and with 5-day intervals. The ephemeris shows declinations for the Sun through Pluto, including Chiron and excluding the Moon. In the chart, a negative value represents South and a positive value represents North. In other words, if Mercury is shown as +23 degrees and 21 minutes, the declination for that date is 23 N 21.

What Is Declination?

Planets travel in a 360° circle around the Sun, but they do not constantly stay at the same latitude. In fact, they are always moving up or down. These “ups and downs” are measured as the distance between a planet’s current position and the earth’s equator (as projected into the sky). This measurement is known as declination.

When you see planets that are at the same degree and both are either North or South, they are said to be Parallel. If they are at the same degree but one is North and the other is South, that is called a Contra Parallel.

These aspects are similar to the conjunction and the opposition aspect.

Parallels exist when there is a conjunction. The meaning will be determined by the planets involved and the houses and signs that they are in. But when two planets are conjunct and parallel, that means they share the same celestial latitude as well as degree.

Contra-Parallel exist when there is an opposition; like the Parallel, it will depend on the planets and their house positions. When two planets are opposed and parallel, that means they share the same celestial latitude, as well as opposing degrees.

There is a special time when the planet is at Zero. This is when they are neither up or down from the celestial equator. This is a time when the planet is going to be strong and the principles of that planet will be emphasized.

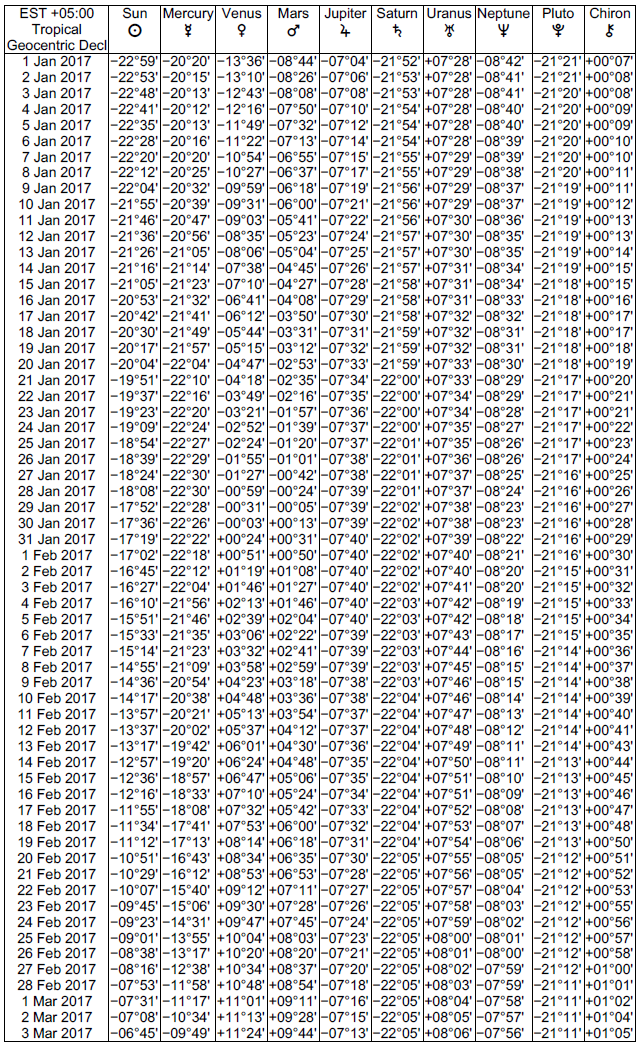
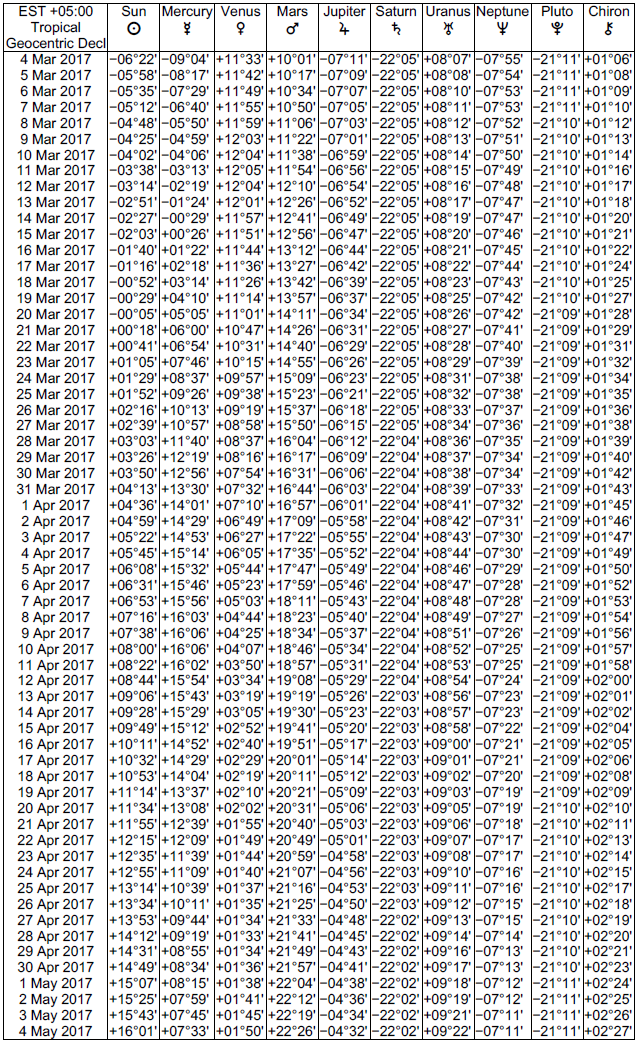
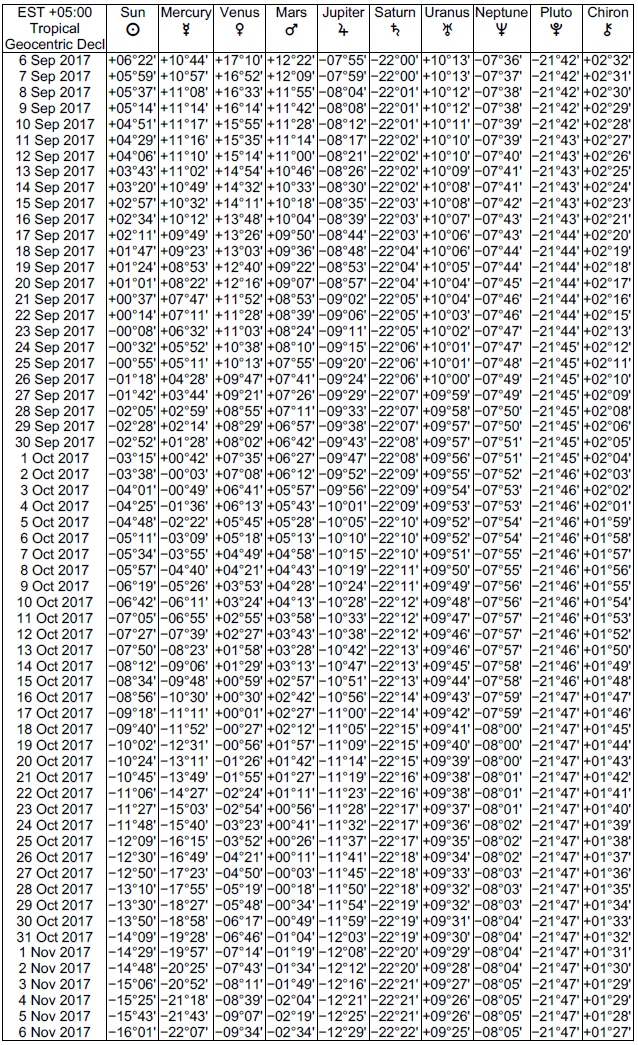
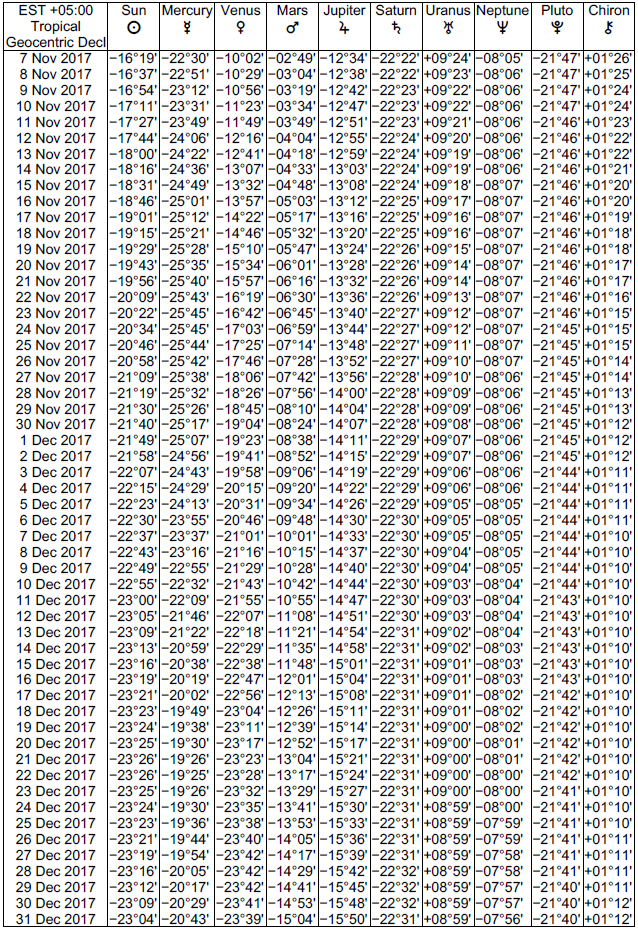
Current Declinations: Declinations for the Years 2015, 2016, and 2017, 1 Day Intervals:

Current Declinations: Declinations for the Years 2015, 2016, and 2017, 1 Day Intervals:
declin95declin96declin97declin98declin99declin100declin101declin102declin103declin104declin105declin106
declin17adeclin17bdeclin17cdeclin17ddeclin17edeclin17f
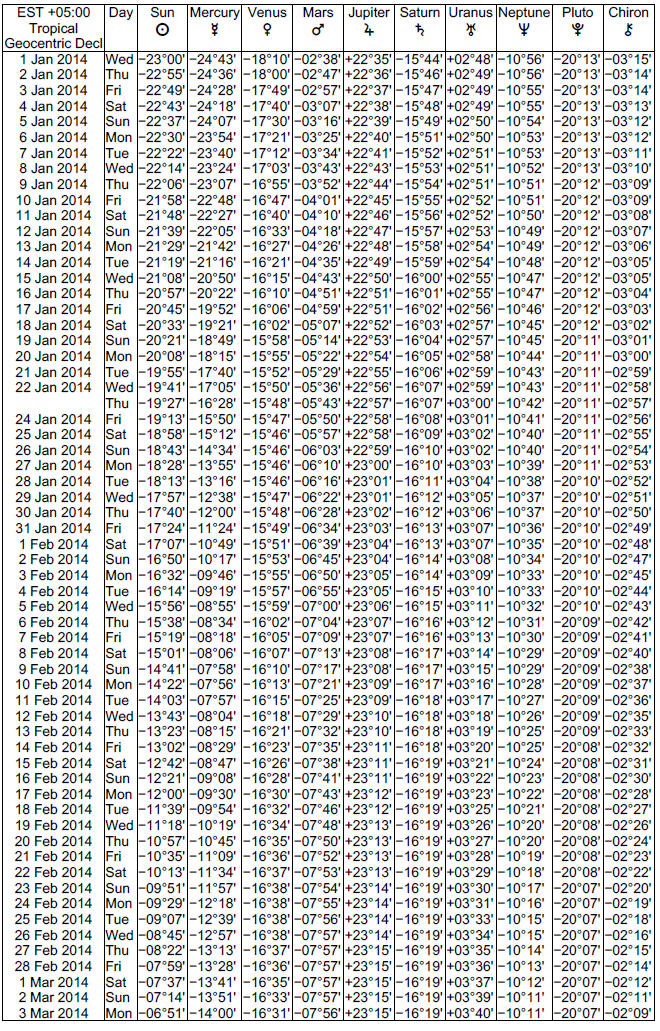
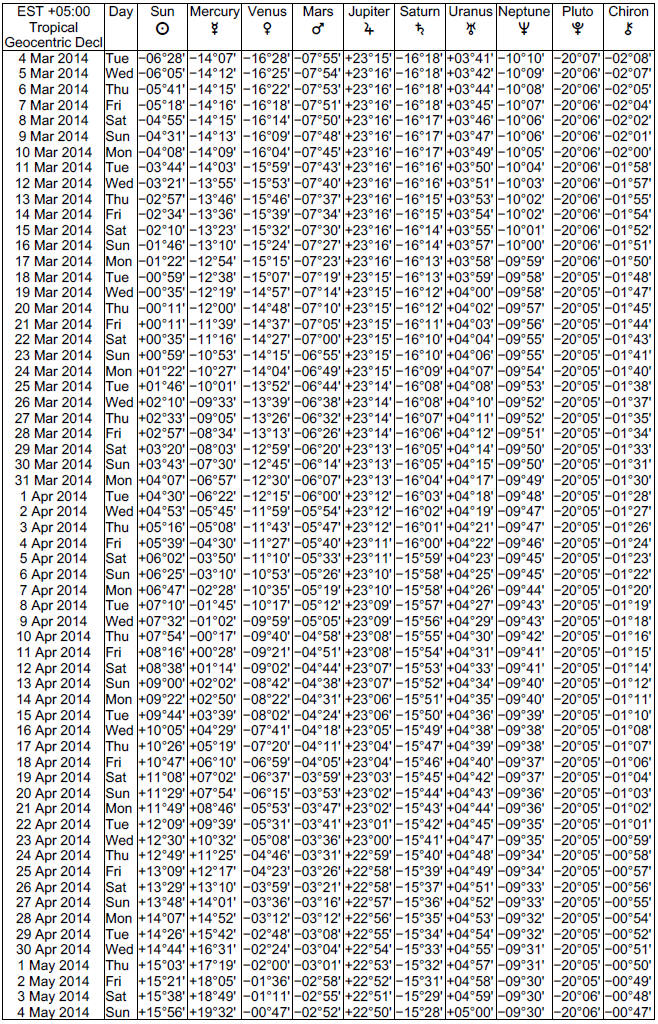
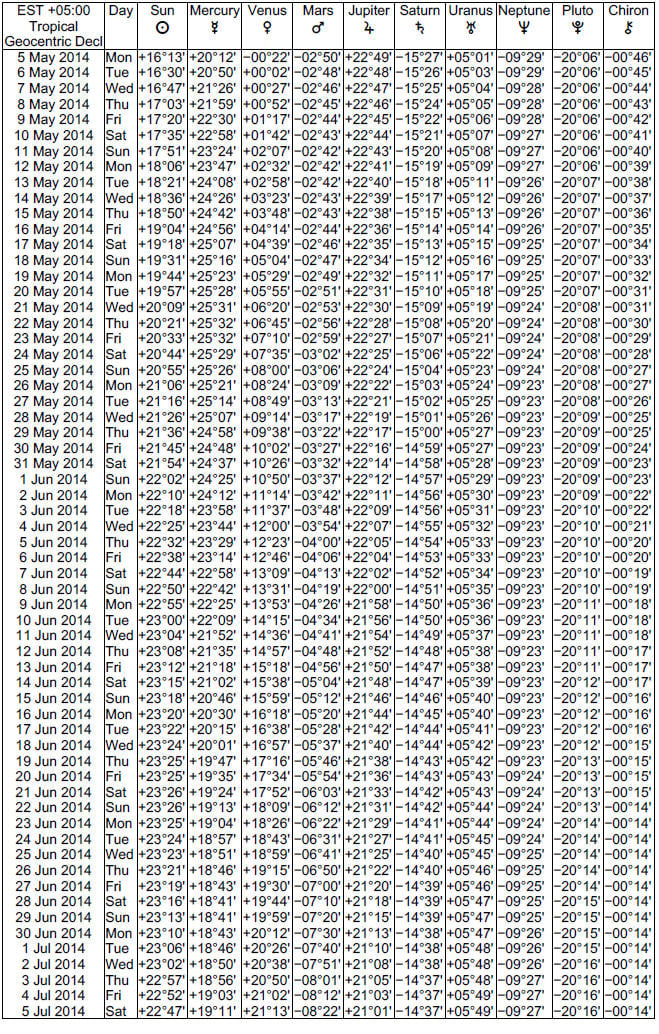
+ corresponds to North; – corresponds to South
See the full ephemeris of declinations for 1940-2014 here (pdf) or from 1930-2025 here (pdf).
Declinations for the Year 2014, 1 Day Intervals:

Monday 21 August 2017

This Month’s Declinations

Declinations Graph
What Is Declination?

Planets travel in a 360 degree circle around the Sun, but they do not constantly stay at the same latitude. In fact, they are always moving up or down. These “ups and downs” are measured as the distance between a planet’s current position and the earth’s equator (as projected into the sky). This measurement is known as declination.

This graph shows you the declinations for each planet for the period of one month.
Agustus

A good example to see this is the moon, since you will see a whole cycle of the moon each 28 days. In the example above, you can see when it makes its maximum up and down, and when it hits the center each month.

How Do I Use The Declination Graph?

The Declination Graph is another way of looking at aspects. To use this graph, just find the planet(s) you are interested in and look at their positions in the graph. When you see planets that are at the same degree (either up or down), they are said to be Parallel. If they are at the same degree but one above and the other below the middle line (celestial equator), that is called a Contra Parallel. These aspects are similar to the conjunction and the opposition aspect.

Parallels exist when there is a conjunction. The meaning will be determined by the planets involved and the houses and signs that they are in. But when two planets are conjunct and parallel, that means they share the same celestial latitude as well as degree.
Contra-Parallel exist when there is an opposition; like the Parallel, it will depend on the planets and their house positions. When two planets are opposed and parallel, that means they share the same celestial latitude, as well as opposing degrees.
There is a special time when the planet is at Zero. This is when they are neither up or down from the celestial equator (the middle line in the graph). This is a time when the planet is going to be strong and the principles of that planet will be emphasized.

Upcoming Months:
September


source Declinations click here

Bitcoin

Bitcoin Technical Analysis

This thread is dedicated to technical analysis of the various Bitcoin and crypto-currency pairs. My own prefered method is Elliott Wave analysis combined with Fibonacci relationships in price action as a means of understanding past action and forecasting future price behaviour. However, analysis amd discussions in this thread are not restricted to these methods.

With the general "newness" of crypto-currencies and the amount of hype surrounding them - and Bitcoin specifically - this thread will serve both as a knowledge exchange as well as a repository for sound technical analysis of the rapidly evolving crypto-currency market.

Brief introduction to Bitcoin

Bitcoin is the most well-known of a range of crypto-currencies presently in circulation. The currency (forex code: BTC) is a digital value token that is accounted for by a decentralized peer-to-peer network comprised of it's users - both buyers and sellers. The same cryptographic algorithm that encrypts and transfers BTC around the network is also responsible for a slow release mechanism whereby a total maximum of 21mil BTC will be released in the course of a just over a century. The logic behind this gradual release strategy is to ensure scarcity in an emulation of resources such as Gold. In an extention of the simile, Bitcoins come into existence through a process called "mining".

BTC has received a lot of media attention following the crash of its speculative bubble in April 2013. Similarly, press attention has focussed on recent cases of non-compliance with US financial regulations by some Bitcoin exchanges.

BTC buying and selling is possible via several exchanges, the biggest (by daily volume) of whom is currently Mt.Gox. A few retail brokers offer BTC option contracts, but long and short CFDs are generally not available except through smaller start-up brokers.

official website bitcoin
chart bitcoin
infographic
bitcoin Indonesia


Bitcoin price history

Bitcoin started trading at 0.04USD in 2009 and achieved an unprecedented growth of more than 5,000% in 3 years before crashing in April 2013.

From April to June 2013, BTCUSD has consolidated around the $120.00 price level.

Brokers

Personally, I use the Mt.Gox exchange and their API which gives me direct access to the largest BTCUSD market without an intervening broker. Mt.Gox charges 0.6 % on all BTC purchases (no fees for selling). Some brokers provide long/short contracts and binary options but these do not suit my current trading strategy with Bitcoin. Mt.Gox is, unfortunately, prone to price feed disruption and their order system can lag severely during market frenzies. For this reason I prefer not to participate during busy times, placing my orders and positions during quiet periods.

Forum Rules

Surprizingly, the thread topic generates a fair amount of emotion and often leads to dicussion involving polarized opinions. To prevent wildfires and maintain a professional tone in this thread, the following ground-rules will apply to any and all members and guests posting here:
This thread exists for co-operative technical analysis of Bitcoin and crypto-currency price charts.
Posts should respect the thread topic and may veer from it for the sake of knowledge sharing related to the topic.
Posted forecasts and predictions should preferaly be accompanied by a chart or other technical object illustrating your statement.
Racist, sexist, homophobic or any other form of hate-speech will not be tolerated or condoned in this thread.
Strong language does not serve the purposes or tone of a public forum, hence you should choose your words and bear others in mind when posting. At the discretion of the thread creator/moderator members and guests may be asked to edit their posts.
Swearing or derogatory language directed at another poster is unacceptable and the author of such will not be protected from the Forex Factory Moderators.
Disruptive or objectively negative posters will be blocked from posting without prior discussion.
I, venzen, have absolute say-so, up to the last word and that is final.

register bitcoin Indonesia click here
link telegram bitcoin 

Sunday 7 May 2017

The Low Volume Candle (LVC)

I know there are many volume related threads here on FF, and some of them are still active.
However, I am opening this thread as a discussion area for a system idea provided by my old buddy hukam, in order to reach a completely tradeable system (auto, manual or both).

I am opening this thread under "Trading Discussion" forums as the idea is still in the analysis phase.

The system life cycle will go into 4 main phases:
1- Analysis Phase.
2- Design and Development Phase
3- Testing Phase
4- Implementation Phase

hukam a genius and generous member on FF, will be the main contributor to this thread.

I am posting here a draft of his idea as received:

Quote

we have to find low volume area on history (compare to

last 15 bar on 5min,
30 bars on 15min,
60 bars on 30min,
120 bars on 60min,
480 bars on 240min charts,

last 15 bar on 5min, we find any low voulme candle and its our target candle ( target candle open, close part is pin point in our strategy).
if candle price is down side, and 1:2 RR, then Low voulme candle (LVC) low part(open or close) + spread is our target.
if price is upside, and 1:2 or better RR, the target LVC upper part(open or close) + spread.

and this this logic applied to all tfs from 5min to 4H tfs
LVC (must be fresh from one part, either close or open should now not cover with any next candle, like fresh zone, wicks can be ignored)

second case if price go 50 pips against us.
if price when against us. its must be going to an old low voulme area
first case have to check any history on 5,15,30,240min is their any old LVC
if yes its our target
we will open new order with target OLD LVC -spread and % wise increment in lot size, so we must have profit when we close booth orders at same time.
open booth order reach in target zone we can close booth orders.

and this loop will be continue from 5-240min,

first loop will check 5min only.. then 15min and then 30min incase its required to find low voulme area.
and this loop also active when we need second hedge order to protect our exisiting order.
incase their is no old zone (then its pure some news, and second opsite order open with at 75pipsloss insted of 50pips loss)
if 75 loss - second order + first main order reach at some level booth can be closed
and main loop will be reactive again.

open source
Development done in this thread will be open source, unless indicated otherwise.

tools
Low Volume Candle Detector LVC Detector 04
download iindicator click here

Regards,

Khalil Abokwaik

compare with fibo timezone, fibo fantrend, fibo expansion & D W MN Line, recomended compare (select one) with Ob-Os, RSI, Volume better & Stochastic indicator


LVC 4, daily chart
Logic Fibo Ret + Exp Feat LVC for momentum